
Manipur
Manipur Population 2024
3,008,546
As per the Aadhar Statistics the Manipur population in 2024 is 3,008,546 (3.01 Millions) as compared to last census 2011 is 2,855,794. Growth rate of 5.35 percent of population increased from year 2011 in Manipur. till 2018.Population in Crores is 0.30 Crores
(February 2019 estimates till December 2018 as per Aadhar Uidai)
| Capital | Imphal |
| Languages | Manipuri |
| Population | 2855794 (2011 Census) |
About Manipur
Manipur is one of the North-Eastern states of India the state comprising of 9 districts, 38 Subdistricts and 2,618 villages. Manipur is bounded by nagaland to the north and mizoram to the soouth and assam to the west and burma to the east. Total area of Manipur is 22,347 sq.kms. Total Population is 27,21,756, out of 13,69,764 are males and 13,51,992 are females. Imphal is the capital of manipur.
Distribution of Population, Decadal Growth Rate, Sex-Ratio and Population Density
| Population 2011 | Decadal growth | Sex Ratio | Population density sq.km | ||||||
| State/District | Persons | Males | Females | 1991-01 | 2001-11 | 2001 | 2011 | 2001 | 2011 |
| Manipur | 27,21,756 | 13,69,764 | 13,51,992 | 24.86 | 18.65 | 974 | 987 | 103 | 122 |
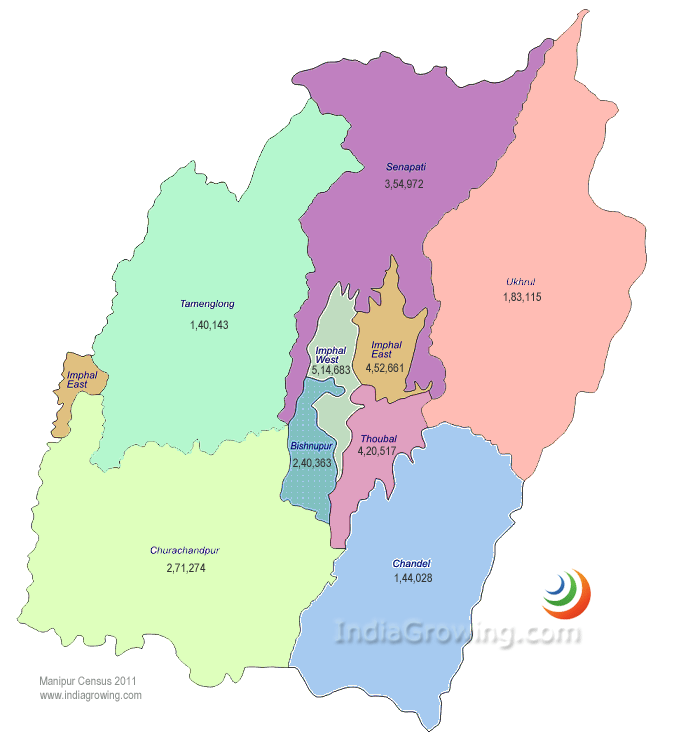
| Senapati | 3,54,972 | 1,83,081 | 1,71,891 | 36.09 | 25.16 | 951 | 939 | 87 | 109 |
| Tamenglong | 1,40,143 | 71,762 | 68,381 | 29.23 | 25.69 | 922 | 953 | 25 | 32 |
| Churachandpur | 2,71,274 | 1,37,748 | 1,33,526 | 29.36 | 19.03 | 944 | 969 | 50 | 59 |
| Bishnupur | 2,40,363 | 1,20,185 | 1,20,178 | 15.27 | 15.36 | 993 | 1000 | 420 | 485 |
| Thoubal | 4,20,517 | 2,09,674 | 2,10,843 | 23.87 | 15.48 | 998 | 1006 | 708 | 818 |
| Imphal West | 5,14,683 | 2,53,628 | 2,61,055 | 16.70 | 15.82 | 1004 | 1029 | 856 | 992 |
| Imphal East | 4,52,661 | 2,25,130 | 2,27,531 | 19.49 | 14.63 | 991 | 1011 | 557 | 638 |
| Ukhrul | 1,83,115 | 94,013 | 89,102 | 28.83 | 30.07 | 916 | 948 | 31 | 40 |
| Chandel | 1,44,028 | 74,543 | 69,485 | 66.62 | 21.72 | 981 | 932 | 36 | 43 |
manipur map
List of Districts, Cities & Towns in Manipur
Cities
Towns
- India
- Andhra Pradesh
- Arunachal Pradesh
- Assam
- Bihar
- Chhattisgarh
- Delhi
- Goa
- Gujarat
- Haryana
- Himachal Pradesh
- Jammu & Kashmir
- Jharkhand
- Karnataka
- Kerala
- Madhya Pradesh
- Maharashtra
- Manipur
- Meghalaya
- Mizoram
- Nagaland
- Odisha
- Punjab
- Rajasthan
- Sikkim
- Telangana
- Tripura
- Tamil Nadu
- Uttarakhand
- Uttar Pradesh
- West Bengal
- Andaman and Nicobar Islands UT
- Chandigarh UT
- Dadra & Nagar Haveli UT
- Daman & Diu UT
- Lakshadweep UT
- Puducherry UT